Click on the link below to view some example data and see how easy it is to view your data using Power BI.
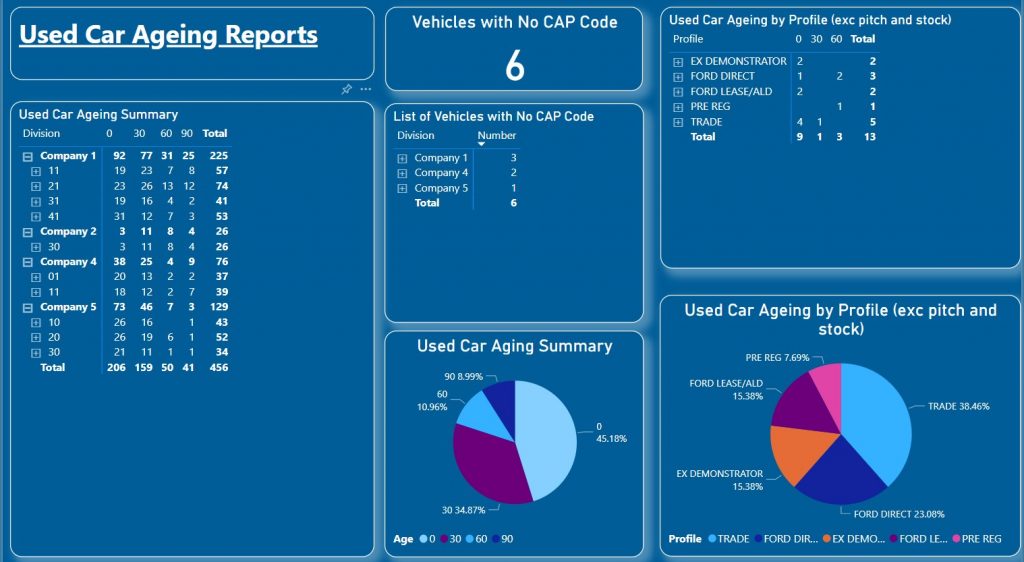
Used Car Ageing Reports
This report shows vehicle stock by your chosen age banding and stock profile.
The example below shows how you can:
- view the stock of the entire Group by company and by location
- view certain data in bit size pieces and just review stock items with missing CAP code – this is designed to highlight the issues easily for your managers on a daily basis
Debtors Reports
This reports on debtors by site and sales person.
The example below shows the debtors and chosen method of how to age of the invoices – enables you to catch over and under invoiced deals and focus your sales teams on getting money in and ensuring information is right.

PRODUCT SALES REPORTS
Click on the link below to be able to view an example data for the Pen % report and see how easy it is to view your data using Power BI.
Product Sales and Pen %
This shows sales of GAP, Diamondbrite and Smart Insurance and allows you to track sales and % by site and salesperson. We can create reports showing management expectations and lost opportunity to shows “What you could have won”
