Click on the link below to view some example data and see how easy it is to view your data using Power BI.
Site DOC
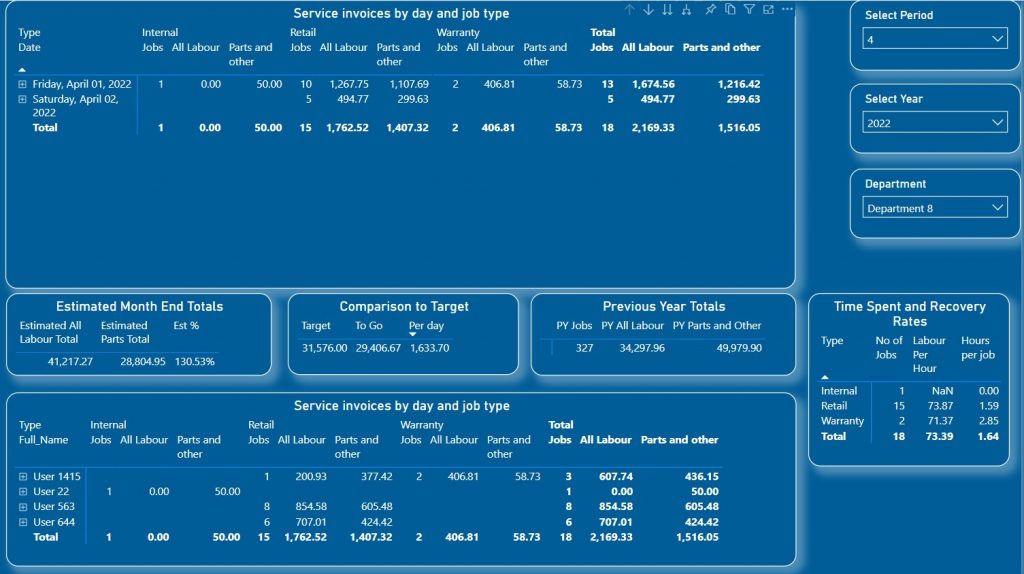
This shows actual labour and Part sales, extrapolated sales for month and comparison to targets
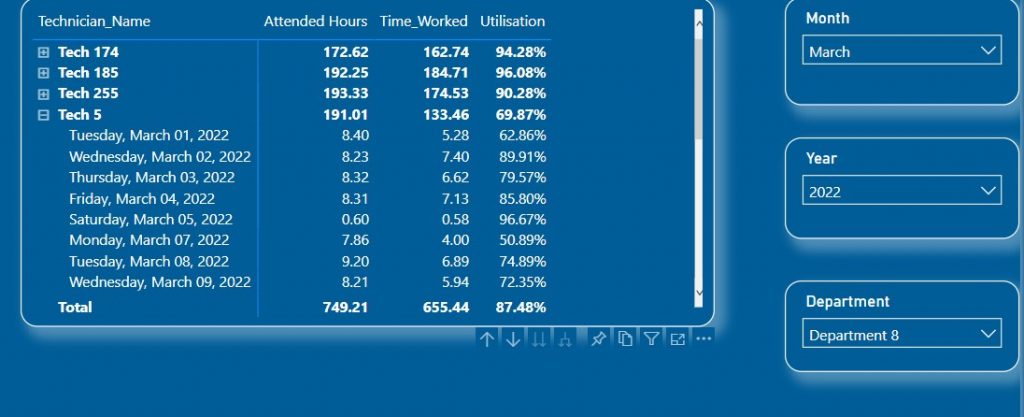
Tech Utilisation
This shows attended hours for any site and allows you to track utilisation by person and even by day
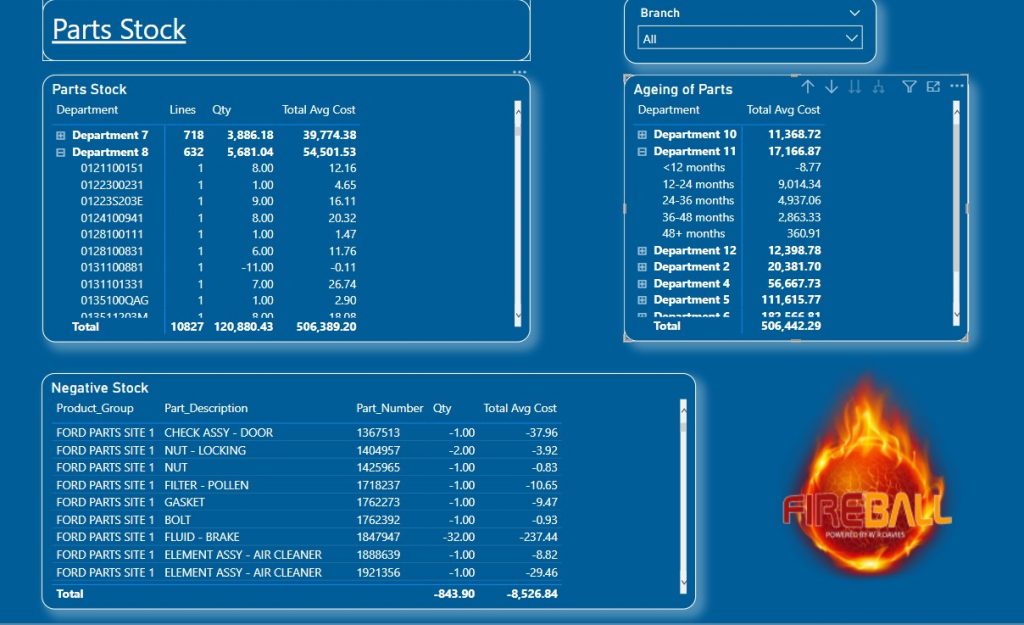
Parts Stock
This shows the parts stock and can be aged on your own requirement, to either match the method of Pinnacle or to ageing as per composite reporting – this can be downloaded into excel for the whole group making month end reporting a breeze.